“Its a great place !!!”
Cliente verificado

BUSINESS INTELLIGENCE
We build Power BI dashboards with relevant metrics, hierarchies and interactive filters, on a maintainable data model under your control.
Power BI dashboards matters when you need interactive Power BI dashboards to track operations, not a pipeline of reports that are sent on their own. Before selecting tools, we define the sources, data and decisions that must remain under your company's control.
We work from Barcelona and Madrid and remotely with teams across Spain, Europe, LATAM and the United States. The process combines decision sessions, verifiable releases and documentation so progress stays visible.
We hand over models, datasets, repositories, configurations and documentation in accounts owned by your company. You can therefore audit, evolve or change supplier without relying on private access or licences.
We build Power BI dashboards with relevant metrics, hierarchies and interactive filters, on a maintainable data model under your control. That is why we prioritise a maintainable, measurable solution ready to evolve without rebuilding its foundations.
THE CHALLENGE
data is scattered and there is no clear view
Each department handles its own data and criteria, so dashboards do not offer a single, reliable view of the company.
The lack of a common semantic model forces manual reconciliation of figures and creates discrepancies between Power BI reports.
Dashboards are built without documentation and become fragile whenever data sources change.
APPROACH
We move forward with measurable decisions and releases that already add value.
We agree with each area on the KPIs that truly drive decisions, avoiding dashboards overloaded with irrelevant metrics.
We build a centralized, well-documented semantic model so all visualizations share the same source.
We develop Power BI dashboards with hierarchies, filters and alerts reviewed together with business owners.
We set up a periodic review plan to incorporate new sources and adjust indicators as the business changes.
DELIVERABLES
We deliver an operational foundation your team can govern and keep improving.
Agreed list of indicators with their definition, formula and owner for each dashboard metric.
Schema of the semantic model with relationships and transformations explained to ease future maintenance.
Functional Power BI dashboards distinguishing the daily operational view from the strategic management view.
Manual with the traceability of each figure, the refresh schedule and rules for publishing changes safely.
TRUST
We implement Power BI and data modelling from Barcelona and Madrid, with governance and delivery under the client's control.
FAQ
Tell us what you need around Power BI dashboards. We will help you turn it into a clear, viable delivery plan.
Lo que dicen empresas que ya trabajan con nosotros
PROYECTOS DESTACADOS
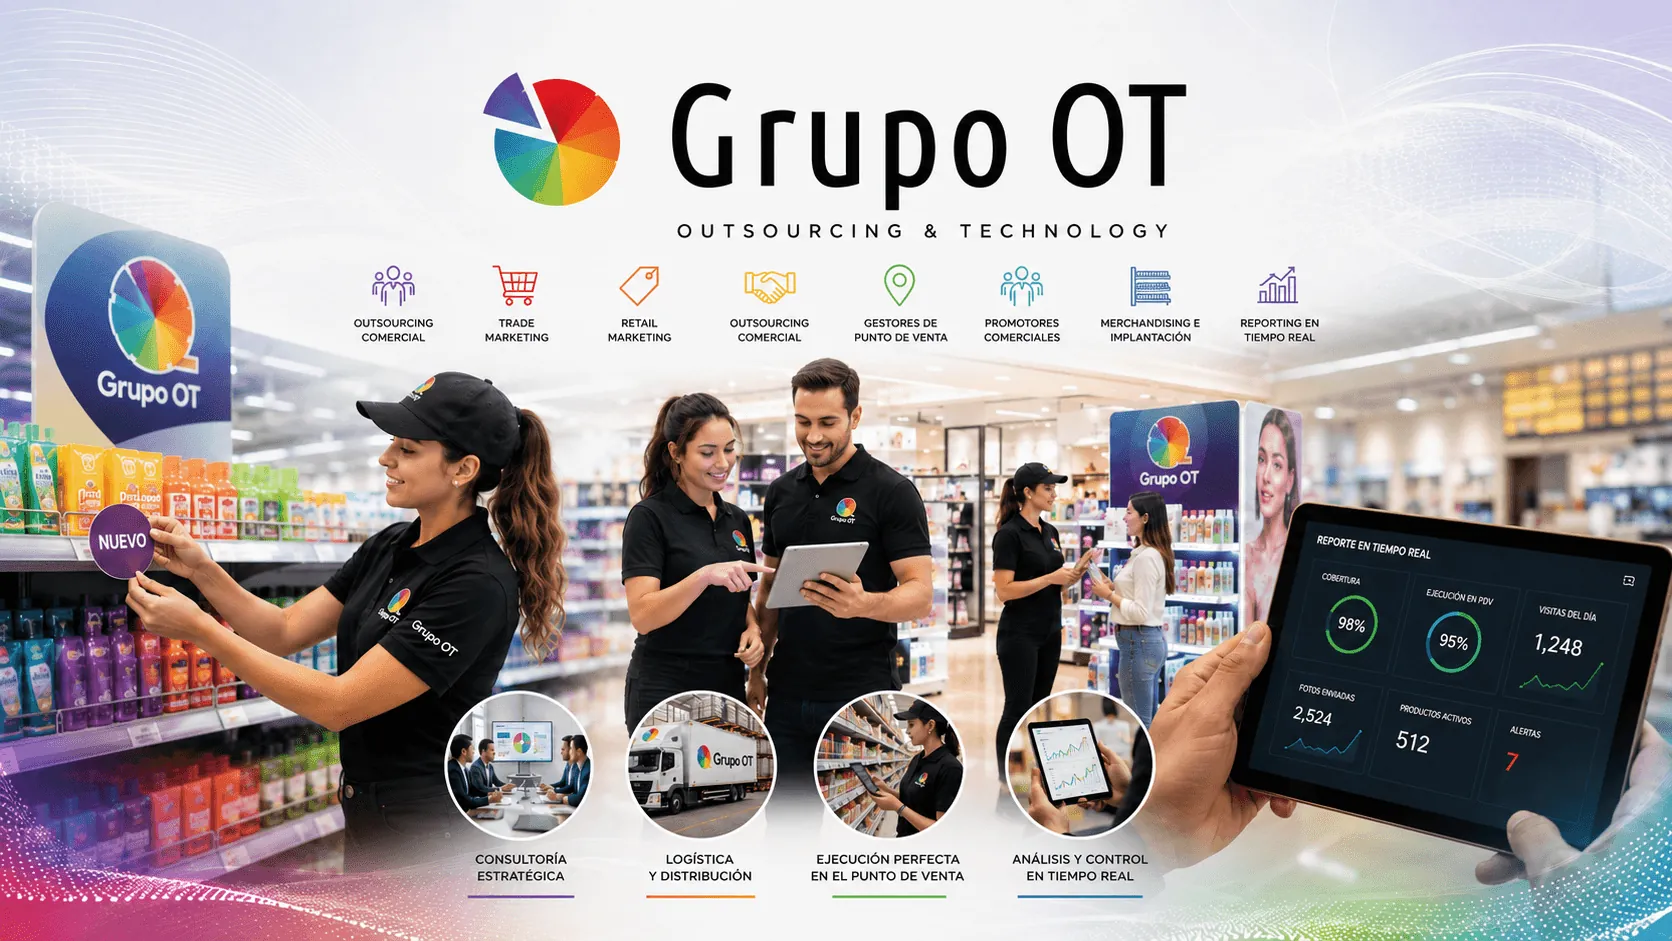 Development+6
Corporate website +7
Industry · Retail and e-commerce
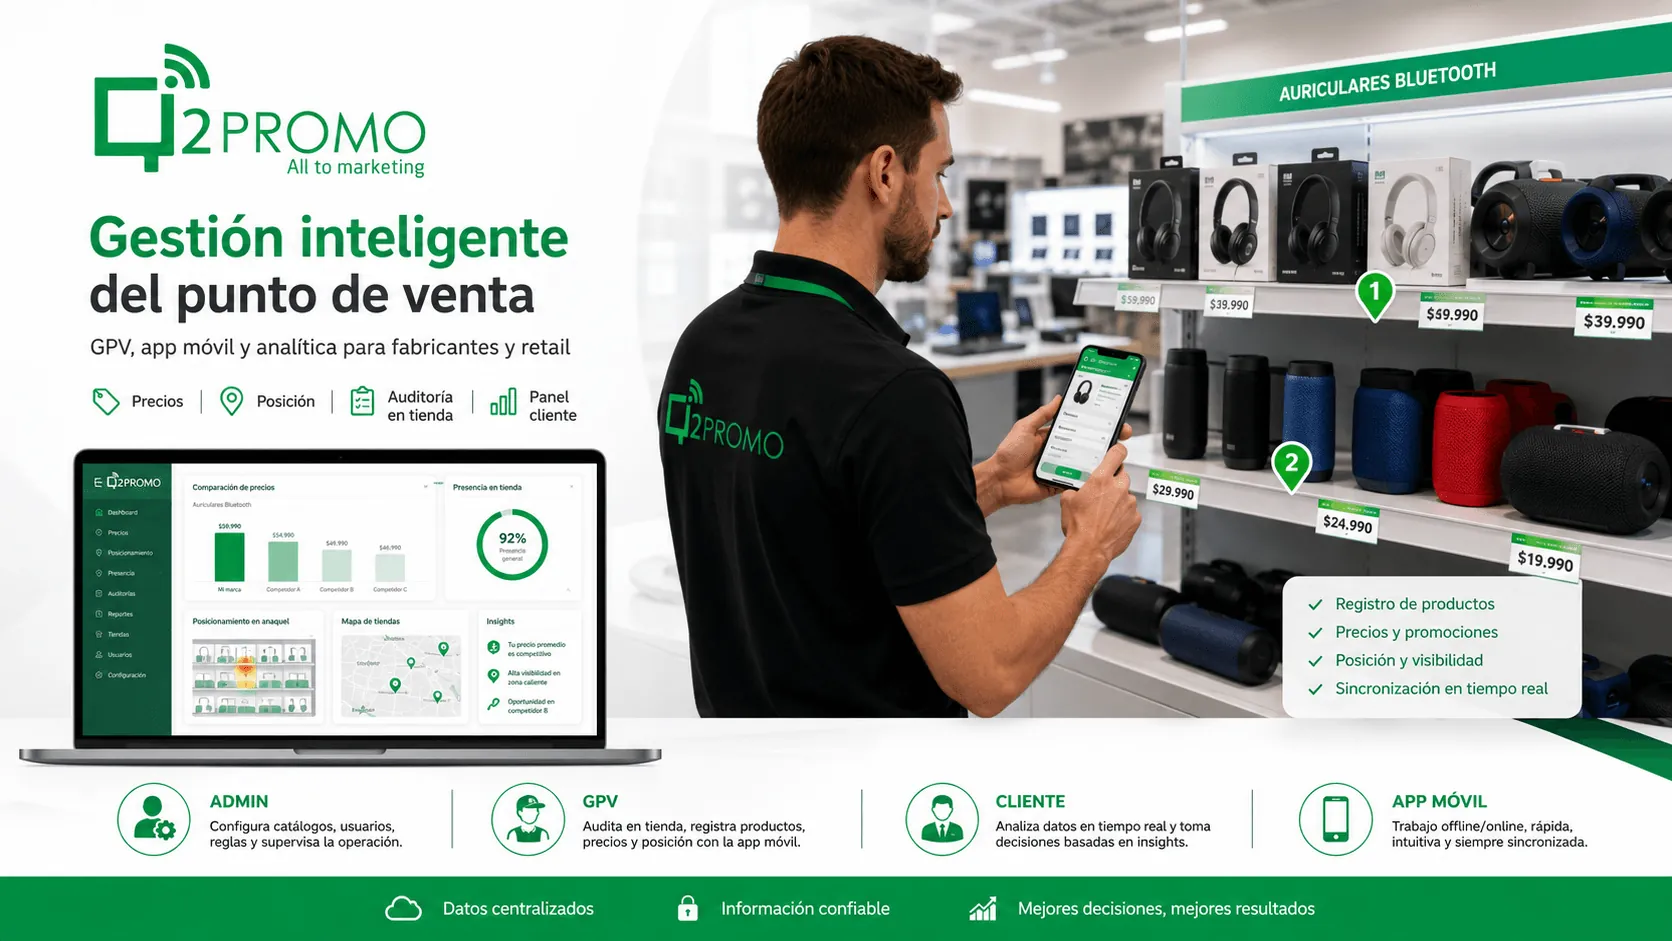 Development+8
Corporate website +8
Industry · Retail and e-commerce
 Development+9
E-commerce / online store +4
Industry · Insurance