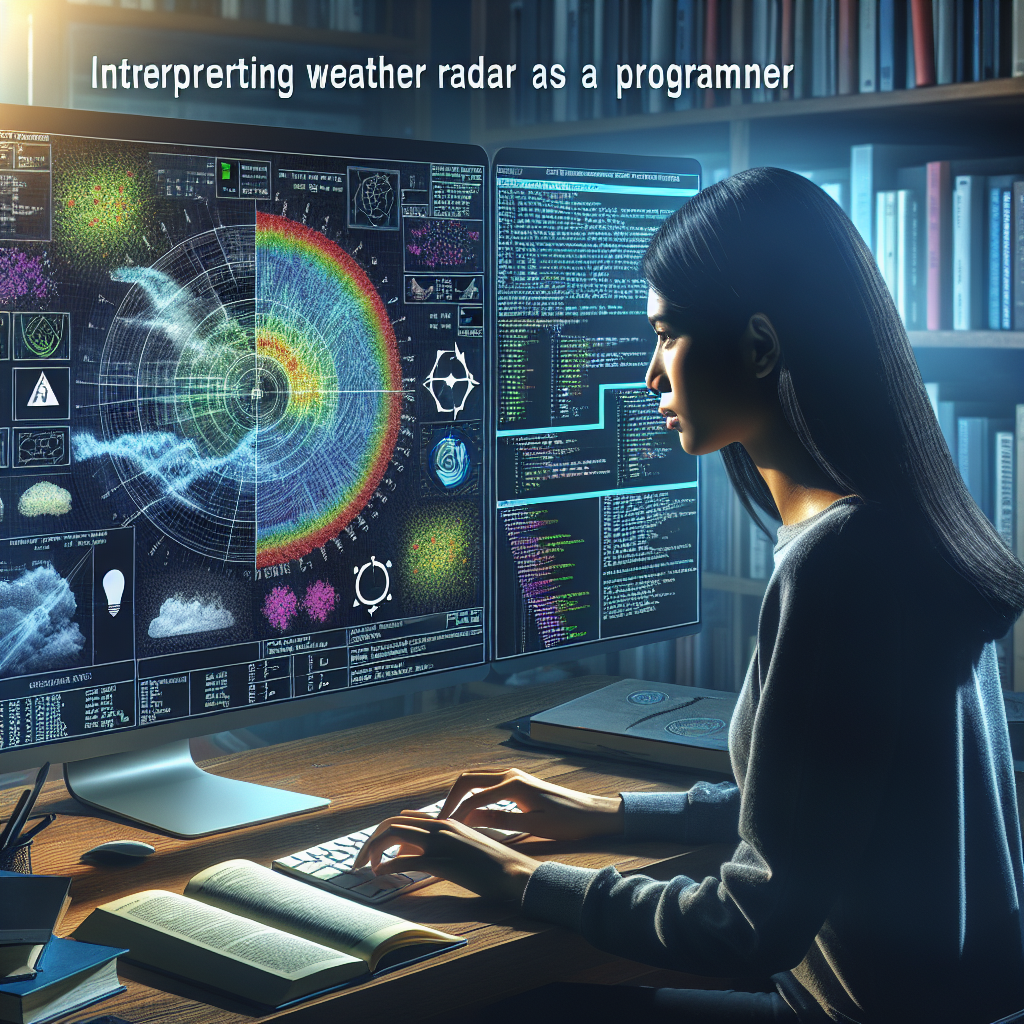
You have probably used a weather app or even built one. But do you really know what radar maps tell you or what they are hiding from you? Understanding a radar map requires looking beyond the colors to understand the physics and limitations of the system.
Weather radars primarily measure reflectivity, expressed in dBZ, which indicates the intensity of the signal reflected by drops, snow, or hail. Warm colors represent strong echoes and heavy rain, while cool colors usually indicate drizzle or weak echoes. However, reflectivity does not always equal surface precipitation: the radar beam rises with distance and can overshoot rain near the ground, giving the false impression of no precipitation in distant areas.
In addition to the reflectivity product, there is Doppler velocity, which shows the movement of air toward or away from the radar. This data allows detecting dangerous winds and rotations that can be associated with severe storms. Velocity must be interpreted carefully because the radar only measures the radial component and can produce aliasing or velocity folding in extreme situations.
Radar has significant physical limitations. Attenuation reduces the signal behind intense precipitation, ground or building echoes generate clutter that must be filtered, and resolution decreases with distance. There are also shadow zones between radar sites if topography blocks the beam. All of this can hide or exaggerate real phenomena.
Dual polarization technology adds useful variables such as differential reflectivity ZDR and correlation coefficient CC that help distinguish rain from hail, snow, or biological echo. A developer integrating radar will understand when to display base reflectivity products, composite products, Doppler velocity, or polarimetric metrics to provide context to the user.
As a developer or advanced user, there are several practices to better read a radar map: animate the sequence to see evolution, check the time of the last scan, toggle between base reflectivity and composite, review the range and radar site in use, and overlay surface and satellite data. If there is uncertainty, it is advisable to cross-reference with observation networks, automatic stations, and numerical models.
If you work on weather solutions and want to integrate radar into an app, consider common data formats and flows such as NEXRAD Level II and III, raster mosaic APIs, WMS services, and netCDF or GRIB formats for models. Managing projections, temporal interpolation, and tile optimization are common tasks in custom applications and custom software focused on weather visualization.
At Q2BSTUDIO we help transform complex data such as weather radar into useful products for end users and businesses. We are specialists in custom software development, custom applications, and artificial intelligence solutions for automatic signal interpretation. We also offer cybersecurity services to protect data pipelines, AWS and Azure cloud services to scale ingestion and processing, and business intelligence services including dashboards with Power BI for operational monitoring.
We offer integration of artificial intelligence models for severe event detection, AI agents to automate alerts and recommendations, and consulting to implement AI for companies that need to improve their resilience against weather risks. Our approach combines expertise in custom software with data analysis and security to deliver reliable solutions.
Final practical tips: when looking at a radar, remember to check the product you are viewing, the scan time, the distance to the radar site, and the possibility of contaminating echoes. For critical decisions, complement radar with surface observations, models, and official alerts. If you need a custom app that integrates radar, analysis with artificial intelligence, Power BI dashboards, or secure cloud solutions, contact Q2BSTUDIO to develop custom software and comprehensive services in artificial intelligence, cybersecurity, AWS and Azure cloud services, and business intelligence services.