
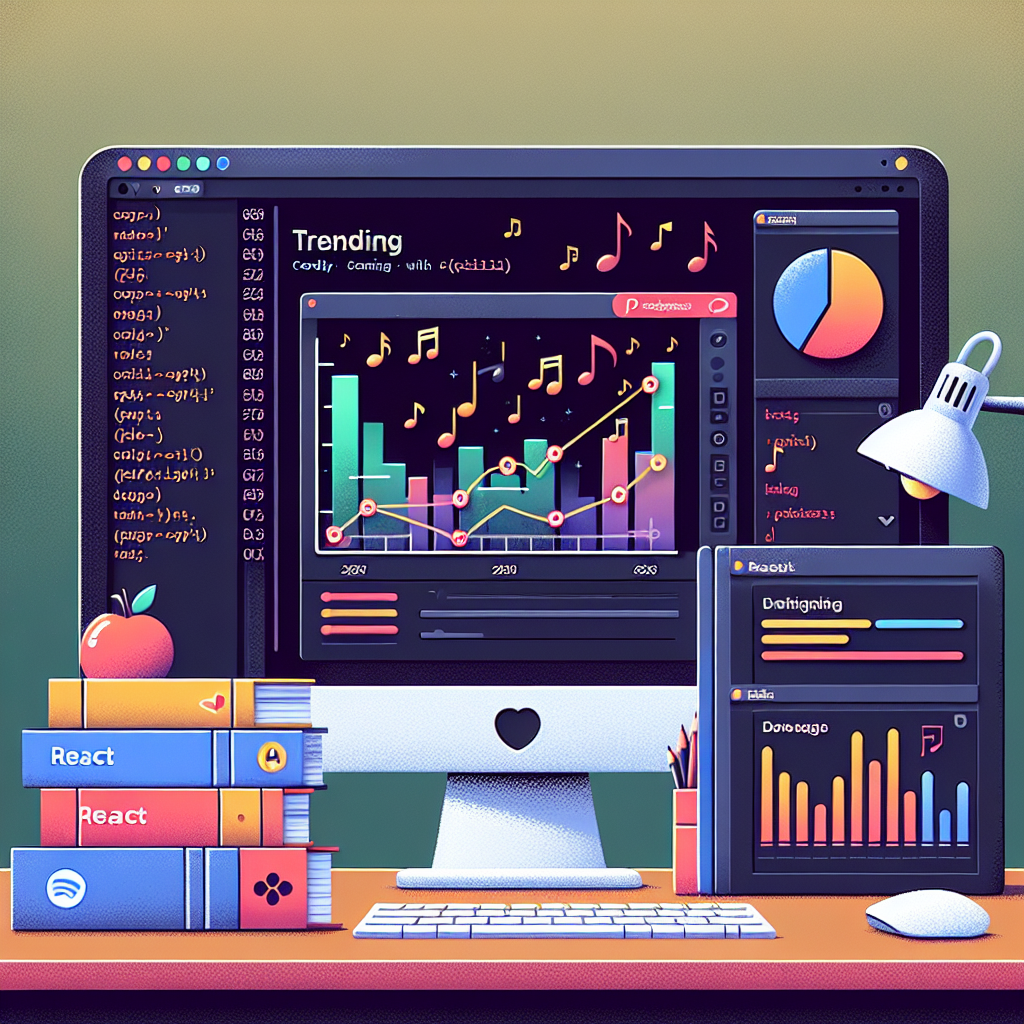
Small and useful project A small but useful project that demonstrates how to create a single-page data analysis application focused on Spotify trends. The goal is to combine React with data visualization libraries to build an interactive dashboard that allows exploring tracks, artists, popularity, tempo, and temporal trends in a clear and dynamic way.
Dashboard description The Simple Spotify Trends dashboard with React and visualization libraries offers a single-page experience with period filters, comparisons between artists, line charts for temporal evolution, bars for popularity, and radar for audio attributes. It can connect to the Spotify API or work with mock data for quick prototypes and uses React hooks to manage state and real-time updates.
Main steps to build it Prepare the project with React, choose a visualization library such as Recharts, Chartjs, D3, or Victory, design reusable components, implement calls to the Spotify API, and normalize the data. Add state control for filters and pagination, create accessible interface components, and optimize loading with lazy loading and memoization.
Recommended libraries and techniques For simple and fast charts, use Recharts or Chartjs; for custom visualizations, use D3; and for ready-made components, Victory. Complement with UI libraries, lightweight state management, and testing. Integrate analysis and data export tools to generate reports compatible with Power BI and other business intelligence service systems.
Corporate integration and deployment This is where Q2BSTUDIO comes in as a technology partner. We are a custom software and application development company specialized in artificial intelligence, cybersecurity, and AWS and Azure cloud services. We can help transform this prototype into a production solution with custom software, reinforced security, and deployment on managed cloud infrastructures.
Added value with artificial intelligence and AI agents Q2BSTUDIO integrates artificial intelligence and AI for businesses to automate insights and recommendations within the dashboard. We implement AI agents that analyze listening patterns, generate predictions, and suggest commercial actions. Additionally, we offer business intelligence services to turn data into competitive advantages and connect the dashboard with Power BI for advanced reporting.
Security and compliance Cybersecurity is key when working with user data. Q2BSTUDIO applies good security practices, secure authentication in API integration, encryption, and auditing. We also adapt solutions to compliance requirements and privacy policies to protect fan and customer information.
Use cases and benefits For record labels, marketing teams, product managers, and analysts, this type of dashboard provides trend visibility, enables data-driven decision-making, and facilitates presenting results with tools like Power BI. With custom applications, you get a solution aligned with internal processes and business objectives.
How we can help If you are looking to take this project to production or develop a custom solution, Q2BSTUDIO offers complete services for custom software development, artificial intelligence integration, AI agent implementation, cybersecurity, AWS and Azure cloud services, and business intelligence services. Contact us to evaluate requirements, design a secure architecture, and deploy a scalable and maintainable dashboard.