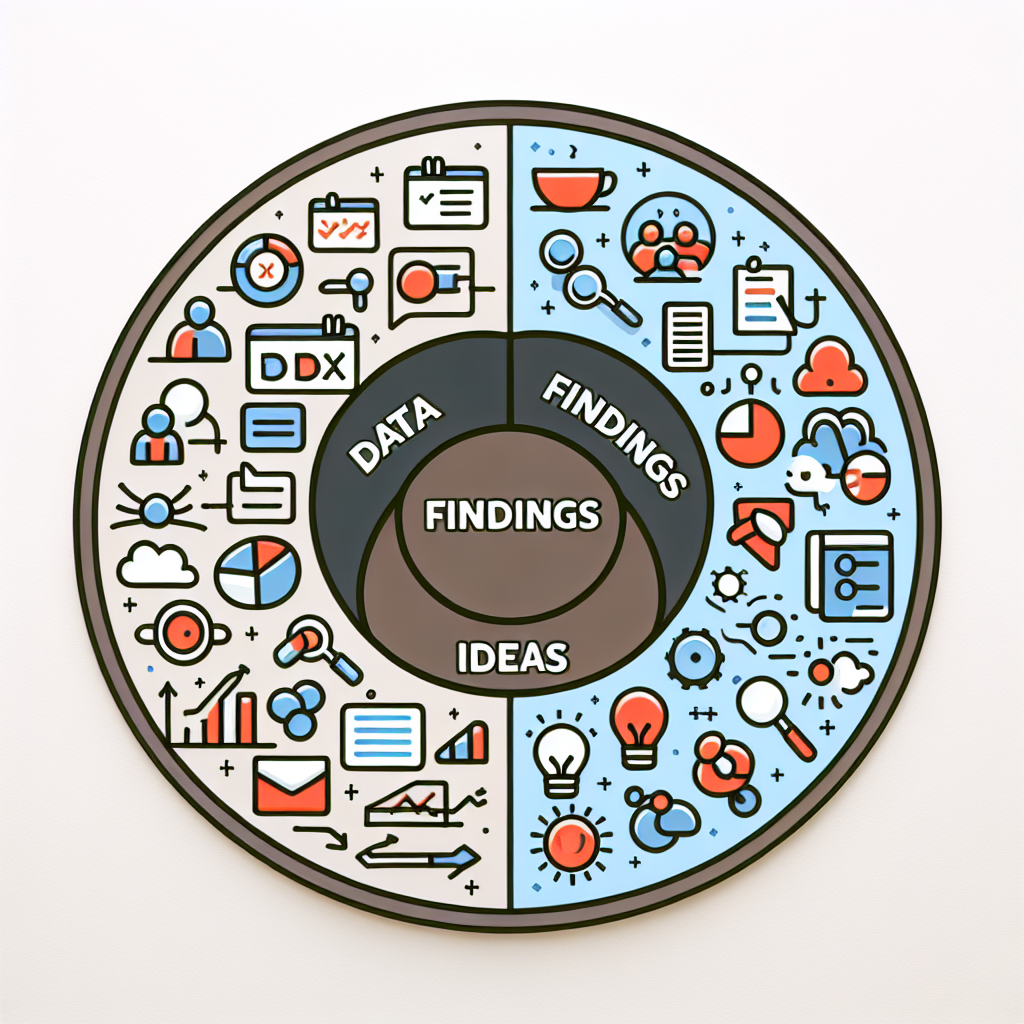
Data Vs. Findings Vs. Insights In UX
In UX research, it is key to distinguish between data, findings, and insights to turn observations into strategic decisions. This article explains each term and how to argue statistical significance in user experience studies, as well as showing how Q2BSTUDIO helps transform data into high-impact digital products.
Data is the raw material: numbers from metrics, event logs, task times, survey responses, session recordings, and application logs. Data can be quantitative or qualitative and often arrives in large volumes when working with custom applications and custom software integrated with aws and azure cloud services.
Findings are patterns or results derived from data after an initial analysis: task success rates, identified bottlenecks, ranking of issues by frequency. A finding answers what happened, but does not always explain why it happened. In business intelligence and power bi projects, findings allow prioritizing operational hypotheses.
Insights are actionable interpretations that connect findings with business and user context: for example, identifying that the abandonment rate in a registration flow increases due to field complexity and lack of immediate feedback. An insight suggests concrete changes that can be implemented by a development team or through AI agents to automate responses.
How to argue statistical significance in UX research Define clear hypotheses: propose a null and alternative hypothesis linked to a measurable metric, for example improving the task completion rate. Select relevant metrics: success rate, time on task, Net Promoter Score, etc. Calculate prior sample size: use estimates of expected effect, confidence level, and statistical power to avoid invalid conclusions from small samples. Choose the appropriate statistical test: t-test for means, chi-square test for proportions, non-parametric tests if data does not meet assumptions, or Bayesian models for direct probabilities. Report p-value and confidence intervals: the p-value indicates evidence against the null hypothesis, while the confidence interval shows the plausible range of the effect. Evaluate effect size and practical significance: a result can be statistically significant but irrelevant to business if the effect is minuscule. Correct for multiple comparisons when testing several metrics simultaneously. Combine with qualitative evidence: interviews, usability tests, and recordings triangulate results and enrich insights. Communicate results clearly: use visualizations, summary tables, and decision-oriented language for stakeholders, indicating uncertainty and concrete recommendations.
Best practices for defending results before stakeholders Present the hypothesis and success criteria before the test, show sample size calculation, explain the chosen statistical test and its assumptions, present confidence intervals and effect size, and translate the impact into ROI or product objectives. Avoid p-hacking and report negative tests just like positive ones to maintain transparency.
Practical example Imagine an A B test to reduce onboarding abandonment. Define metrics: completion rate. Calculate sample size to detect an expected improvement of 5 points with 80 percent power. Run the test, obtain the observed difference, calculate p-value and confidence interval. If p is less than 0.05 and the confidence interval does not include zero, we can conclude that the change has statistical evidence; then we evaluate whether the improvement is sufficient to justify development.
What Q2BSTUDIO brings Q2BSTUDIO is a software development company that offers custom applications and custom software, and brings experience in artificial intelligence, cybersecurity, and aws and azure cloud services. We implement data pipelines, analytics tools, and business intelligence and power bi service solutions to turn data into findings and transform findings into actionable insights. Our specialists in AI for businesses and AI agents automate pattern detection and generate recommendations that accelerate product decisions. We also ensure data cybersecurity and cloud scalability so your UX experiments are reproducible and secure.
Use cases Development of power bi dashboards for continuous monitoring of usability KPIs, integration of machine learning models for user segmentation, deployment of AI agents that personalize onboarding in real time, and cybersecurity audits to protect user data. All within aws and azure cloud service architectures and with support from business intelligence services to prioritize product changes.
Conclusion Differentiating data, findings, and insights allows turning tests and experiments into product decisions with measurable impact. Arguing statistical significance requires rigorous design, sample calculation, appropriate tests, and clear communication of uncertainty and effect size. Q2BSTUDIO accompanies that process from data capture to the implementation of solutions with artificial intelligence, AI agents, and power bi, ensuring security and scalability through cybersecurity and aws and azure cloud services. Contact Q2BSTUDIO to design robust UX tests and create custom applications that turn insights into competitive advantages.