Part 4 The data flow from raw to ready
Introduction
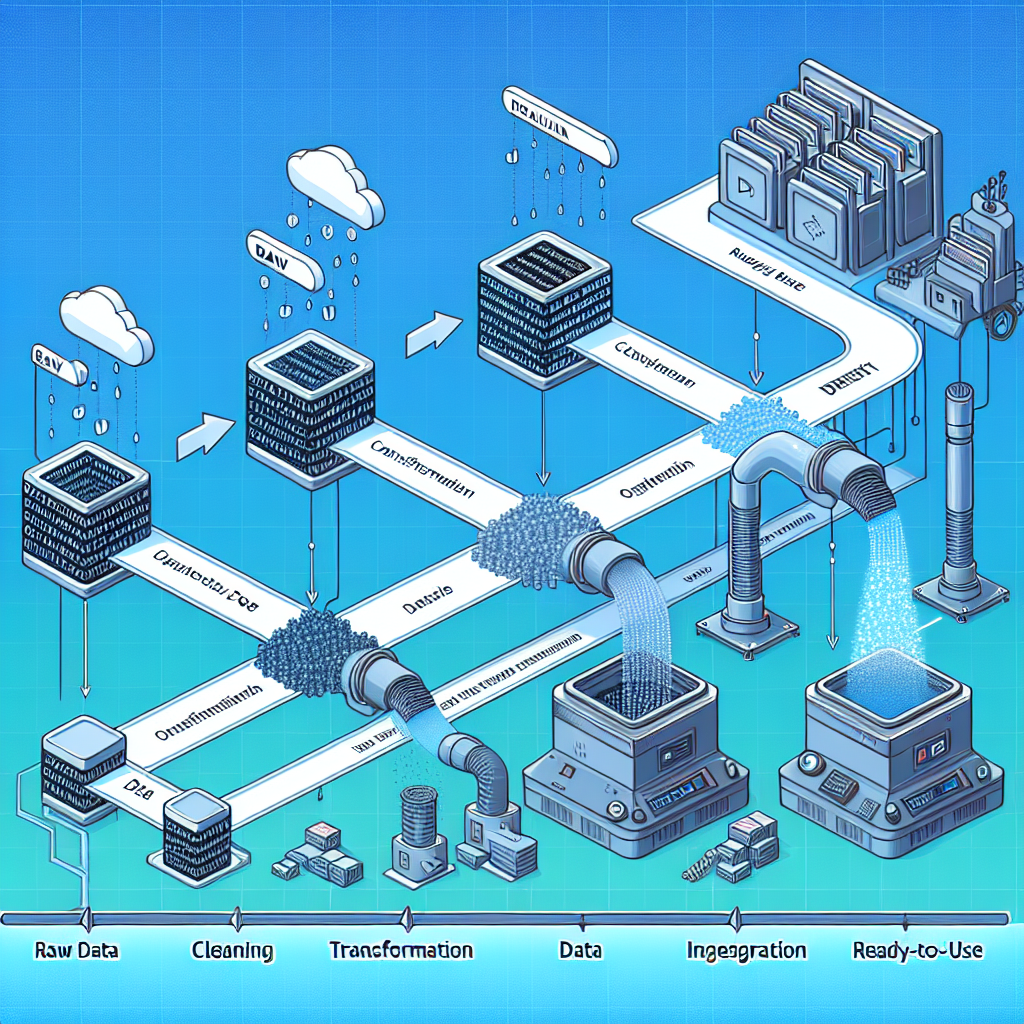
Working with data is similar to cooking: there is a sequence of steps needed to turn raw ingredients into an appetizing dish. In data analysis, you cannot present unprocessed information and call it a result. Following a workflow transforms raw data into useful information for decision-making.
The 6 steps of the data flow
1 Collection Gather data from reliable sources, both internal and external, for example databases, sensors, logs, or APIs. At Q2BSTUDIO we help design efficient data pipelines for custom applications and custom software.
2 Cleaning Correct errors, remove duplicates, and handle missing values. The quality of the cleaning determines the reliability of the analysis. Our experience in artificial intelligence facilitates automatic anomaly detection.
3 Analysis Look for patterns, trends, and relationships. This is where analytics and business intelligence services like Power BI come into play to translate numbers into decisions. Q2BSTUDIO integrates artificial intelligence and AI models for companies that enrich the analysis.
4 Visualization Present the findings with clear charts and dashboards. Visualizing reduces ambiguity and makes it easier for non-technical teams to understand the meaning of the data.
5 Telling the story Add context and explain why the results matter. A good narrative connects insights with concrete actions for the business.
6 Act Apply the findings to optimize processes, launch products, or adjust strategies. The action stage is the ultimate goal of the data flow.
Why follow the process
Skipping steps can lead to erroneous conclusions and costly decisions. A documented workflow ensures reproducible analyses and reliable results. At Q2BSTUDIO we combine cybersecurity practices with quality controls to protect data at every stage, including aws and azure cloud services.
Activity for beginners
Step 1 Choose a simple topic, for example your monthly expenses.
Step 2 Describe how you would collect the data, how you would clean it, and what questions you would analyze to find savings or unusual patterns.
Step 3 Create a basic diagram of the data flow and save it for reference. You can use free tools or integrate them with custom solutions offered by Q2BSTUDIO.
How Q2BSTUDIO helps
Q2BSTUDIO is a custom software and application development company specialized in artificial intelligence, cybersecurity, and aws and azure cloud services. We offer custom software, business intelligence services, and AI solutions for companies such as AI agents or integrations with Power BI. Our approach combines technical expertise and business orientation to deliver secure, scalable projects aligned with commercial objectives.
Next step
In Part 5 Beginner-friendly tools we will explore practical tools you can use today without expensive software, including options for visualizing with Power BI and connecting artificial intelligence models.
Question for you
Which step of the workflow do you think would be most difficult for you to put into practice