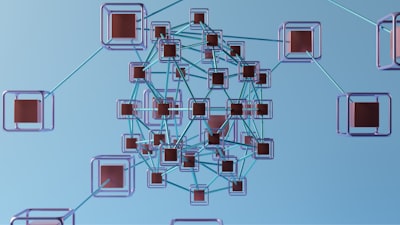
In the analysis of geospatial data and population distribution, the detection of spatial clustering patterns has traditionally been addressed with tools such as Moran's I index. This statistic, widely used in geography and social sciences, measures local spatial autocorrelation by comparing neighboring values. However, its approach based on predefined spatial weights limits the ability to capture complex global structures. This is where an innovative concept emerges: the Metropolis-Hastings diffusion distance, a metric that evaluates the discrepancy between two probability distributions on a graph, measuring the convergence rate of a Markov chain towards a steady state.
The diffusion distance, proposed as an alternative to classical methods, uses the Metropolis-Hastings transition matrix with proposals obtained from a random walk over the graph. When the target distribution is uniform, this distance becomes an indicator of spatial clustering. Unlike the Moran index, which only considers direct relationships between neighbors, the diffusion distance integrates the overall geometry of the graph, revealing patterns that would otherwise go unnoticed. This property makes it especially valuable in fields such as urban sociology, epidemiology or social network analysis.
From a technical point of view, the diffusion distance is supported by solid theoretical foundations: limits based on the graph spectrum and connections with the optimal transport. These fundamentals ensure stability and allow for the design of efficient statistical tests. Under null permutation models, high probability bounds are derived that make it feasible to perform spatial clustering tests on massive datasets. This ability to scale is crucial for enterprise applications where the volume of information grows exponentially.
A relevant case study is the analysis of the African-American population distribution in one hundred American cities. While the Moran index shows moderate differences, the diffusion distance detects subtle variations in urban segregation patterns, offering a more nuanced view. This additional sensitivity allows researchers and urban planners to identify areas of intervention more accurately.
In the business context, the ability to measure spatial clusters accurately has direct applications in market intelligence, logistics, and resource planning. For example, a company that wants to optimize the location of its stores or distribution centers can benefit from this type of analysis to identify clusters of potential customers. The implementation of these models requires robust technological development, which combines custom applications with artificial intelligence frameworks and scalable cloud services.
To carry out these advanced analyses, it is advisable to have a team specialized in artificial intelligence for companies that can design AI agents capable of processing large volumes of geospatial data. Integrating broadcast distance into a data pipeline requires everything from data ingestion to interactive visualization. This is where software comes into play as it Q2BSTUDIO developed, adapting complex algorithms to the specific needs of each business. In addition, dashboards can be implemented in Power BI that display real-time clustering metrics, facilitating data-driven decision-making.
The underlying infrastructure is equally critical. Markov string calculations on large graphs require efficient computing power and storage. Using AWS and Azure cloud services, you can deploy parallel processing clusters that run the necessary simulations without bottlenecks. Cybersecurity is another fundamental pillar, especially when handling sensitive population or location data. Q2BSTUDIO offers pentesting and data protection solutions to guarantee the integrity and confidentiality of information.
The convergence between advanced statistical methods such as diffusion distance and modern technology platforms opens up opportunities for business intelligence. Organizations can move from descriptive to predictive analytics, anticipating clustering patterns and responding proactively. For example, in the retail sector, identifying concentrations of demand allows you to adjust inventories and marketing campaigns more accurately. In the public sphere, authorities can plan transport routes or social services based on the detection of vulnerability clusters.
In conclusion, the Metropolis-Hastings diffusion distance represents a significant advance in the measurement of spatial clustering, overcoming the limitations of the Moran index. Its practical implementation, however, requires a technological ecosystem that combines custom applications, cloud infrastructure, and visualization tools. Q2BSTUDIO, as a software and technology development company, is prepared to accompany organizations on this path, offering everything from the conceptualization of the model to its deployment in production. If your company is looking to extract hidden value in its geographic data, exploring these new metrics can make the difference between a superficial view and a deep understanding of the patterns that define your market.