In today’s business landscape, expense management has become a critical factor for an organization’s financial health and operational efficiency. A well-designed expense management application not only digitizes the reimbursement process but also provides strategic insights into spending patterns, policy adherence, and transaction profitability. To measure the success of this tool, it is essential to have performance indicators (KPIs) that cover both operational and strategic perspectives, ensuring the solution delivers tangible value to the business.
At Q2BSTUDIO, we specialize in developing custom software applications that integrate with existing systems and adapt to each organization’s approval rules. Our expertise in process automation and in incorporating emerging technologies such as AI and BI enables us to design solutions that not only meet functional requirements but also drive innovation and competitiveness.
To structure an effective measurement strategy, KPIs should be grouped into five essential categories: operational efficiency, user experience, financial impact, quality and compliance, and adoption. Below are the key indicators for each category, along with examples of how they can be measured and the actions that can be derived from the results.
Operational Efficiency
1. Cycle Time – Measures the average time from expense submission to final approval. A reduced cycle time indicates greater agility and fewer bottlenecks. It can be calculated as the difference between the submission date and the approval date, averaged per transaction.
2. Automation Rate – Percentage of approval processes that occur automatically without human intervention. A high automation level reduces errors and frees human resources for higher-value tasks.
3. Monthly Throughput – Number of expenses processed per month. This metric helps identify workload and plan solution scalability.
User Experience
1. Net Promoter Score (NPS) – Assesses employees’ willingness to recommend the application. A high NPS usually correlates with an intuitive interface and a frictionless process.
2. Resolution Rate – Average time it takes to resolve a support case. A low resolution time indicates efficient support and well-designed problem-solving.
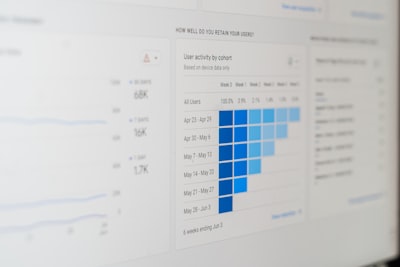
3. Active User Retention – Percentage of users who continue using the app after 6 months. Retention is a direct indicator of perceived usefulness.
Financial Impact
1. Processing Cost Savings – Difference between the manual cost before and the current cost after implementing the application. This KPI demonstrates immediate ROI.
2. Solution ROI – Calculated as (net benefits / total investment) × 100. A positive ROI confirms the project’s economic viability.
3. Revenue Increase from Optimized Spending – Identify renegotiation opportunities or volume purchases that generate additional revenue.
Quality & Compliance
1. Error Rate – Percentage of transactions requiring correction or resubmission. A low rate indicates a robust process and effective validation.
2. Audit Findings – Number of deviations detected during internal or external audits. Reducing these findings is key to maintaining financial integrity.
3. Policy Adherence – Percentage of expenses that comply with predefined corporate policies. This KPI helps ensure governance and transparency.
Adoption
1. Daily (DAU) and Monthly (MAU) Active Users – Measure usage frequency and tool dependency.
2. Advanced Feature Usage – Percentage of users who use advanced functions such as automatic receipt capture, corporate card integration, or custom report generation.
3. Satisfaction Surveys – Qualitative feedback that complements quantitative data and reveals improvement areas.
For these KPIs to be truly useful, they must be integrated into a dynamic dashboard that allows executives to visualize trends, identify deviations, and make data-driven decisions. At Q2BSTUDIO, we design dashboards with Power BI that update in real time and adapt to each user’s role, ensuring information is relevant and actionable.
Moreover, data security is a fundamental pillar. By integrating the application with cybersecurity solutions and hosting it on AWS/Azure cloud infrastructure, the confidentiality of receipts and the integrity of financial records are protected.
In conclusion, measuring the success of an expense management application requires a holistic view that covers efficiency, user experience, financial impact, quality, and adoption. By setting clear KPIs and aligning them with the organization’s strategic goals, companies can maximize their technology investment return and foster a culture of responsible and transparent spending.