Process automation has become a cornerstone of modern business competitiveness. When we talk about automating end-to-end workflows—such as 'order-to-cash' or 'procure-to-pay'—we're not just cutting manual tasks; we're integrating data, decisions, and analytics into a single value chain. This raises a common question: does process automation include dashboards and reports?
The answer is yes, but with nuance. An end-to-end automation partner, like Q2BSTUDIO, designs workflows that connect systems and people, and also delivers analytical tools that let decision-makers monitor performance in real time. Dashboards and reports are not optional add-ons; they are a natural extension of automation that ensures visibility, traceability, and continuous improvement.
To understand why dashboards are essential, break automation into three layers: orchestration, execution, and analysis. Orchestration coordinates systems and tasks, execution handles the actual activity (via RPA, microservices, or workflow engines), and analysis turns generated data into actionable insights. Without the last layer, automation remains operational, lacking strategic impact measurement.
In practice, dashboards and reports are built on a data architecture that captures events, metrics, and logs. This data flow typically pulls from heterogeneous sources: ERP, CRM, billing systems, external APIs, and IoT devices. Data is normalized, stored in a data lake or warehouse, and exposed via APIs or BI connectors. Q2BSTUDIO, for instance, leverages n8n for workflow integration, Power Platform for app and workflow creation, and custom software for the data layer.
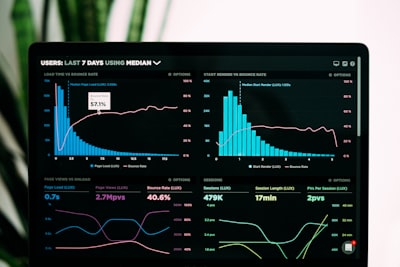
Pre-built dashboards cover high-level KPIs such as revenue, cost, cycle time, and SLA compliance, enabling executives to gauge business health at a glance. Operational dashboards offer filters, drill‑downs, and cohort analysis to spot bottlenecks and optimize processes. Both types allow data export to BI tools like Power BI or Tableau for greater analytical flexibility.
Automation also benefits from artificial intelligence. AI agents can predict trends, detect anomalies, and recommend corrective actions. When integrated into dashboards, users gain predictive insights that go beyond historical visualization. For example, an AI agent might alert a supply‑chain delay before it becomes a problem, allowing managers to act preemptively.
Cybersecurity is another critical aspect. Automating processes involves transferring sensitive data and executing automated tasks that may be vulnerable to attacks. Q2BSTUDIO incorporates security practices such as multi‑factor authentication, encryption in transit and at rest, and regular security audits. Integration with pentesting solutions ensures automated flows do not introduce new vulnerabilities.
The cloud is the natural environment for deploying automation and analytics solutions. Hosting flows and dashboards on AWS or Azure provides scalability, high availability, and access to advanced AI and analytics services. Q2BSTUDIO offers cloud services that include migration, secure environment setup, and cost optimization. Learn how the cloud can boost your automation.
Report delivery is another automation benefit: scheduled emails or messaging app pushes (Teams, Slack) keep stakeholders informed. Reports can be static or interactive and role‑based, ensuring timely decision‑making.
For companies seeking a holistic approach, combining automated processes, real‑time dashboards, and scheduled reports creates a data ecosystem that drives agility and innovation. Automation is no longer just operational efficiency; it’s a strategic enabler.
In short, process automation includes dashboards and reports as essential components. A partner like Q2BSTUDIO delivers efficient workflows and the analytical infrastructure needed to measure and optimize performance. By integrating AI, cybersecurity, and cloud solutions, organizations gain a holistic view that lets them respond quickly to market changes and maintain a competitive edge.