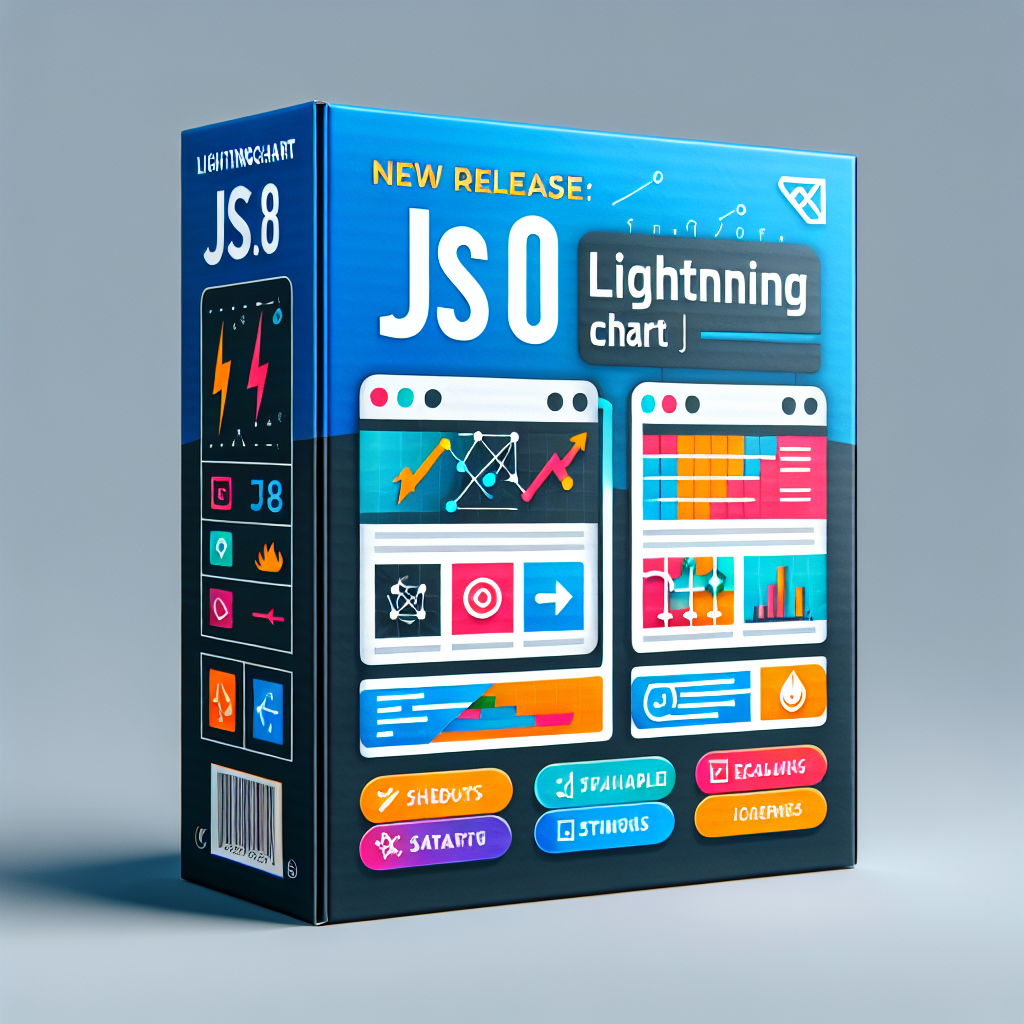
Today we present LightningChart JS 8.0, the new version of a data visualization library aimed at creating high-performance JavaScript chart applications for complex scenarios.
LightningChart JS allows you to develop interactive, real-time visualizations with a focus on performance, visual quality, and developer experience. Version 8.0 brings significant improvements that benefit both development teams and end users.
Complete legend overhaul Legends have been redesigned to adapt to the available space, avoid overlapping with visualizations, and make them easier to configure through a more powerful API. Legends now automatically appear under trends, multiple legends can be created manually, specific series can be excluded, and position and click behavior can be customized with built-in options or custom plugins.
Cursor marker changes The default style of the cursor point marker is now a transparent circle that improves the readability of the highlighted value and prevents obstructions in the data view.
Improved cursor adjustment for small charts Internal logic has been added so that cursor content remains visible even in charts with limited available space, improving usability on compact screens and embedded widgets.
DataSetXY restructuring DataSetXY includes performance improvements and memory savings. Highlights include shared timestamps that can reduce memory consumption by up to 2x, separate storage formats to adjust precision when 64-bit is not needed, and data mapping that speeds up switching between displayed channels and improves efficiency.
Outstanding performance results In tests with multichannel EEG examples, LightningChart JS 8.0 loaded data sets 8 times larger than before, handling up to 8,000,000,000 data points in a single scenario. Additionally, CPU consumption in real-time line series was reduced by approximately 63%, and in real-time scatter series by approximately 245%.
These improvements make LightningChart JS 8.0 an ideal choice for projects that require visualization of large data volumes, real-time streaming, and high-fidelity charts.
About Q2BSTUDIO At Q2BSTUDIO, we are a custom software and application development company specialized in advanced technology solutions. We offer custom software services, custom applications, and integration of high-performance libraries such as LightningChart JS to create dashboards and analytical tools tailored to each client.
Our services include artificial intelligence and AI for businesses, custom AI agent development, cybersecurity, AWS and Azure cloud services, and business intelligence services with Power BI. We integrate artificial intelligence solutions with real-time visual analytics to maximize decision-making and improve critical processes.
If you are looking to optimize data visualization, accelerate projects with large volumes of information, or deploy secure cloud solutions, Q2BSTUDIO can help you design custom software that combines LightningChart JS 8.0 with AI, cybersecurity, and business intelligence capabilities.
Contact Q2BSTUDIO to explore how we can take your custom applications to the next level with high-performance visualization technologies, artificial intelligence, AI agents, Power BI, AWS and Azure cloud services, and comprehensive cybersecurity and business intelligence solutions.